
Introduction
I believe strongly in plotting the data that I obtain, because plots tell you a story and they don’t mislead you like summary statistics can.
Often I want to plot data the arduino has acquired, but I find existing solutions don’t suit my needs. So I went out and made my own solution which writes a GNUPlot script in response to plot commands. I integrated the library with my general Arduino Toolbox (WDArduinoLib) and am releasing it under the GNU 2.0 License.
Goals
- Professional graphics
- Graphs manually editable after plotting for change colours etc.
- Arduino outputs data that other people can defiantly grab and use (just paste into a cloud based GNUPlot terminal)
- Allow embedded linux system to offload the plotting of graphs from arduino collected data
- Easy straight forward API
- Linux, Windows and Mac compatible.
- Quality API documentation
Features
- Configurable output
- You can use a Serial Port, SD-Card, Telnet, TCP-IP, IrDA, whatever. So long as it derives from the Arduino Print class (ie has Print and Println()) this library can output a graph to it
- Uses GNUPlot as a server to execute the plot script this API outputs.
- GNUPlot is the standard for scientific publication, it outputs presentable graphics ready for both websites, and software manuals.
- GNUPlot has been around forever (1986) and is still actively developed.
- GNUPlot can run on the Raspberry pi, PC, Mac or even online via http://plotshare.com/
- Extensible
- Easily over-rideable classes to add new plot types or different output terminal (eg Matlab)
- Built in quality colour palettes designed for graphing.
- Sample palettes for showing importance, of keeping different coloured categories at the same intensity.
- Spectral palettes , optimised for on-white graphing.
- Colour-blind compatible palettes .
- Can still use arbitrary 24bit RGB colours if you like.
- Unit tested library to support quality software development
- Template driven code designed for maximum data flexibility
- Memory Efficient.
- Use of progmem strings supported throughout.
- Useful, stable data format that does not rely on someone’s pet project still existing in 5 years time.
- All input, including text, is validated.
Examples
This library is simple to use and produces clean results with minimal configuration. I present several basic examples that show the API in use and the results obtained.
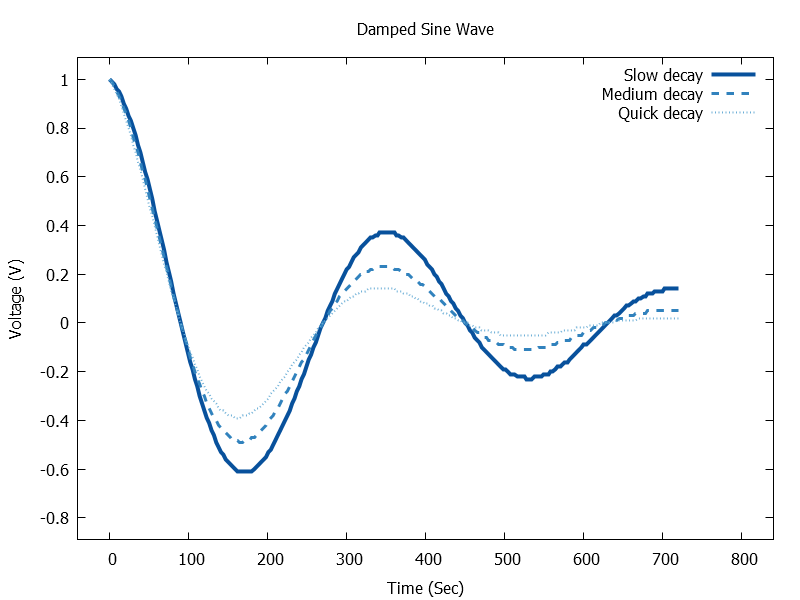
Example: Basic Line Graph
Line plots of time series data are probably the most important feature any graphing API targeted for micro-controllers can offer. This code creates such a plot. It demonstrates the use of multiple line styles.
//main
GNUPlotLineGraph gnuLinePlotter(&Serial);
PlotDampenedSineWaves(gnuLinePlotter);

//method
void PlotDampenedSineWaves(SerialGraph& plot)
{
	//setup graph
	plot.newGraph();
	plot.enableSaveImageFile(true);
	plot.setTitle(F("Dampened Sine Wave"));
	plot.setXAxisName(F("Time (Sec)"));
	plot.setYAxisName(F("Voltage (V)"));

	//setup series
	plot.setSeriesName(0, F("Slow decay"));
	plot.getLineApperance(0)->setLineStyle(LineStyles::SolidLine);
	plot.getLineApperance(0)->setLineWidth(4);
	plot.getLineApperance(0)->setRGB(GraphColorsSchemeBlues::Blue1);


	plot.setSeriesName(1, F("Medium decay"));
	plot.getLineApperance(1)->setLineStyle(LineStyles::DashedLine);
	plot.getLineApperance(1)->setLineWidth(3);
	plot.getLineApperance(1)->setRGB(GraphColorsSchemeBlues::Blue2);

	plot.setSeriesName(2, F("Quick decay"));
	plot.getLineApperance(2)->setLineStyle(LineStyles::DotedLine);
	plot.getLineApperance(2)->setLineWidth(2);
	plot.getLineApperance(2)->setRGB(GraphColorsSchemeBlues::Blue3);

        //plot graph
	for(int i=0; i<=720; i+=3)
	{
		float c = cos(DEG_TO_RAD*(float)i);
		float y1 = Dampen(i, c, 1, 1.0/360.0);
		float y2 = Dampen(i, c, 1, 1.0/240.0);
		float y3 = Dampen(i, c, 1, 1.0/180.0);

		plot.plotDatumXYn(i, y1, y2, y3);
	}
	plot.finishGraph();
}
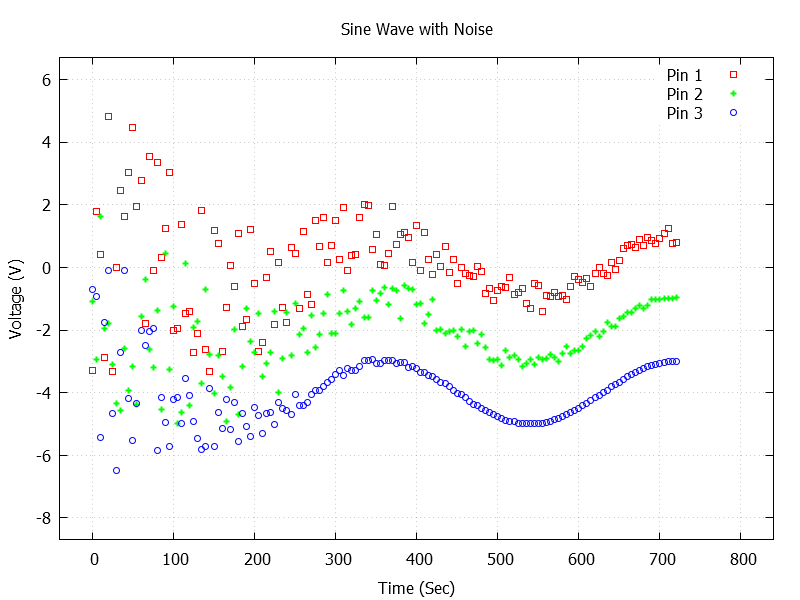
Example: Plotting Points (Scatter Plot)
A scatter plots, with styles colours and trimmings.
//main
GNUPlotPointGraph gnuPointPlotter(&Serial);
PlotPointNoise(gnuPointPlotter);

//method
void PlotPointNoise(SerialGraph& plot)
{
	//setup graph
	plot.newGraph();
	plot.enableSaveImageFile(true);
	plot.setTitle(F("Sine Waves with Noise"));
	plot.setXAxisName(F("Time (Sec)"));
	plot.setYAxisName(F("Voltage (V)"));
	plot.setShowGrid(true);

	//setup series
	plot.setSeriesName(0, F("Pin 1"));
	plot.getLineApperance(0)->setMarkerStyle(LineMarkers::SquareMarker);
	plot.getLineApperance(0)->setRGB(0xff0000);

	plot.setSeriesName(1, F("Pin 2"));
	plot.getLineApperance(1)->setMarkerStyle(LineMarkers::CrossMarker);
	plot.getLineApperance(1)->setRGB(0x00ff00);

	plot.setSeriesName(2, F("Pin 3"));
	plot.getLineApperance(2)->setMarkerStyle(LineMarkers::CircleMarker);
	plot.getLineApperance(2)->setRGB(0x0000ff);

        //plot graph
	for(int i=0; i<=720; i+=5)
	{
		float c = cos(DEG_TO_RAD*(float)i);
		float y1 = c + Dampen(i, ((float)(random(100)-50)) *0.1, 1, 1.0/240.0);
		float y2 = c + Dampen(i, ((float)(random(100)-50)) *0.1, 1, 1.0/180.0)-2;
		float y3 = c + Dampen(i, ((float)(random(100)-50)) *0.1, 1, 1.0/90.0)-4;

		plot.plotDatumXYn(i, y1, y2, y3);
	}
	plot.finishGraph();
}
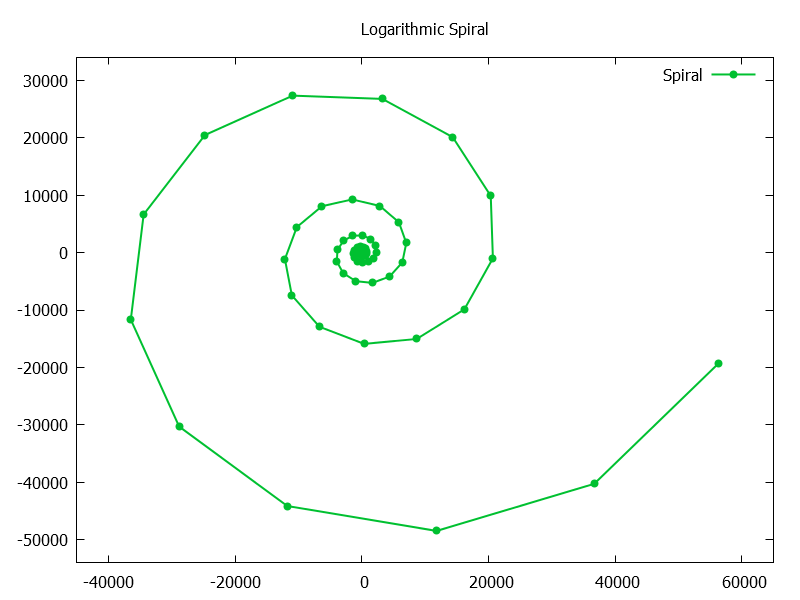
Example: Plotting Arbitrary Lines
Sometimes your not using time series data, and need to plot lines between arbitrary x/y positions. Many solutions for the arduino breakdown at this point. Here I demonstrate such a plot (based on the logarithmic spiral). Note I am using lines with point markers to show the actual points plotted.
//main
GNUPlotLineGraph gnuLinePlotter(&Serial);
PlotLogarithmicSpiral(gnuLinePlotter);

//method
void PlotLogarithmicSpiral(SerialGraph& plot)
{
	//setup graph
	plot.newGraph();
	plot.enableSaveImageFile(true);
	plot.setTitle(F("Logarithmic Spiral"));

	//setup series
	plot.setSeriesName(0, F("Spiral"));
	plot.getLineApperance(0)->setLineWidth(2);
	plot.getLineApperance(0)->setMarkerStyle(LineMarkers::SolidCircleMarker);
	plot.getLineApperance(0)->setRGB(GraphColorsSchemeSpectral::Spectral7);

	//plot graph
	float a = 1;
	float b = 0.1759;
	for(int i=0; i<(int)(10.0*20.0*M_PI); i+=5)
	{
		float t = ((float)i) * 0.1;
		float rt = a*pow(M_E, b* t);
		float x = rt*cos(t);
		float y = rt*sin(t);

		plot.plotDatumXY(x, y);
	}

	plot.finishGraph();
}
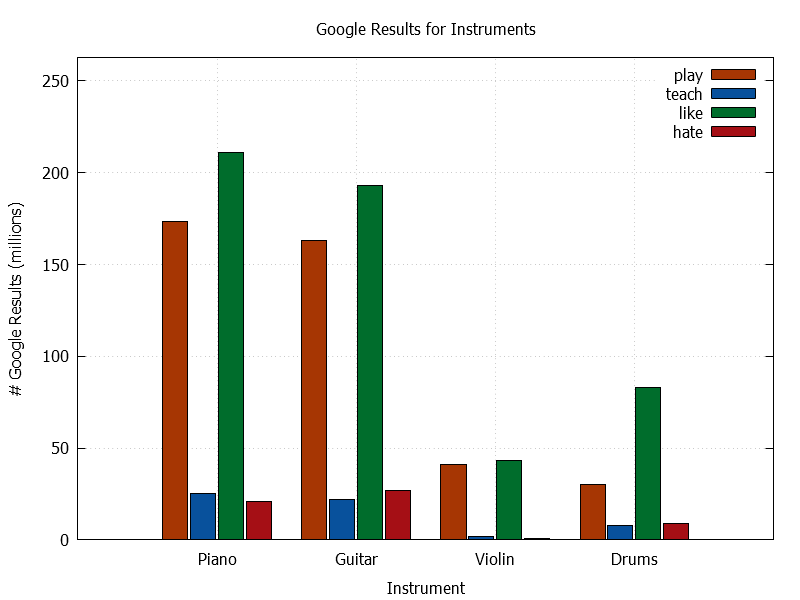
Example: Multi Column Bar Graph.
Bar graphs, for histograms and such are easy in this API. The example below shows support for multi column graphs, Note: negative values are also supported. The labels for the X-Axis are plotted as standard x values (the plot command is template driven and can support many different types of data).
//main
GNUPlotBarGraph gnuBarPlotter(&Serial);
PlotSampleBarGraph(gnuBarPlotter);

//method
void PlotSampleBarGraph(SerialGraph& plot)
{
	//setup graph
	plot.newGraph();
	plot.enableSaveImageFile(true);
	plot.setTitle(F("Google Results for Instruments"));
	plot.setXAxisName(F("Instrument"));
	plot.setYAxisName(F("# Google Results (millions)"));
	plot.setShowGrid(true);

	//setup series
	plot.setSeriesName(0, F("play"));
	plot.getLineApperance(0)->setRGB(GraphColorsSchemeOranges::Orange1);
	plot.setSeriesName(1, F("teach"));
	plot.getLineApperance(1)->setRGB(GraphColorsSchemeBlues::Blue1);
	plot.setSeriesName(2, F("like"));
	plot.getLineApperance(2)->setRGB(GraphColorsSchemeGreens::Green1);
	plot.setSeriesName(3, F("hate"));
	plot.getLineApperance(3)->setRGB(GraphColorsSchemeReds::Red1);

	//plot graph
	//Dataset compiled by Google-ing "I X the Y"
	//                instrument	play	teach	like	hate
	plot.plotDatumXYn("Piano",		173,	25,		211,	21);
	plot.plotDatumXYn("Guitar",		163,	22,		193,	27);
	plot.plotDatumXYn("Violin",     41,		2,		43,		1);
	plot.plotDatumXYn("Drums",		30,		8,		83,		9);

	plot.finishGraph();
}
Installation
- Get the library from its github repository.
- See the official guide on how to install libraries https://www.arduino.cc/en/Guide/Libraries
- Run the provided example sketch
- Install GNUPlot v5.0 or later (here).
- Using the com port viewer, copy the output of sketch into GNUPlot.
- Enjoy!
It is very possible to get the output generated by this library to GNUPlot automatically. How you achieve this is up to you.
It is possible to direct the output to a SD card. See the arduino help page on the file class, to create you own file on a SD card. Then pass the open file object in to the constructor for your plotting class (where I used Serial in the examples).
Documentation
Full documentation available here.
License
GNU 2.0
State
Most Features are well tested, but I don’t warrant or accept liability for any of the functionality in any way.
NB: some dynamic memory usage , refrain from using malloc during plotting operations to prevent possible heap fragmentation.
- Dynamic memory usage is a design decision I made weighing pro’s and con’s of the situation.
- Given ‘typical usage’ scenarios of the API it should not cause heap fragmentation.
Road-Map
May happen:
- Second x/y axis support
- Matlab support
- 3d plots
- Spectrogram
- Support for cloud based rendering for graphs
- Sage support
- Thousands separator (right now I could not deploy it because of a bug in the windows version of GNUPlot).
Won’t Happen:
- Real-time visualisation (plenty of other projects to do that already)